HAIL (HRT AI Labs) was lucky to host several talented Algo Developer interns during the HRT 2022 Algo Summer Internship program. These interns tackled the topic of “artificial intelligence in trading” from a broad variety of perspectives, with some fascinating results obtained in the short five weeks they spent on a rotation with our team. In this blog post, we’re highlighting the work of four interns across three topics:
- Applying Large Language Models to Financial News, by Max Emerling
- Signal Architecture Search, by Louie Putterman
- Transformers for Market Data, by Sean Mann and Jerry Mao
Applying Large Language Models to Financial News
By Max Emerling
Large language models (LLMs) like OpenAI’s GPT-3 have demonstrated impressive results in Natural Language Processing over the past couple of years. It is debatable if these models are truly “smart” or getting us closer to true “Artificial General Intelligence,” but one thing is for sure: they know a lot. Baked within the hundreds-of-billion parameters in these models is an impressive ability to perform tasks that range from financial analysis to writing romance stories. The former, as you might expect, is important to us here at HRT, so it would be nice to find a way to extract structured information from these models and the unstructured data they are trained on.
It may help to think of an LLM as a big, messy database. In a way, prompting an LLM is similar to querying for a certain subset of its training data. However, a very simple change in the style or wording of your prompt can drastically affect the quality of your results. For example, if we prompt an LLM with “Database company name: MARATHON DIGITAL HOLDINGS INC. Competitors: “then it will complete the “sentence” incorrectly with “Bitcoin, Ethereum, Litecoin.” Perhaps the name being in all-caps is the issue? Changing the prompt to include “Simple company name: Marathon Digital Holdings” gives us a better completion: “Bitmain, Canaan, Halong Mining” (Marathon Digital Holdings owns and operates cryptocurrency mining hardware).
While impressive, using LLMs to trade is more complex. To start, we need a market moving source of text for LLMs to analyze. One natural fit here is news headlines – short strings of text that often lead huge market moves. Still, there are many ways we could make a trade. Let’s start simple – given a set of known market-moving headlines, can an LLM predict the direction the market moved? We found that if we just give the headline and ask if it is positive or negative, the results are not much better than tossing a coin. However, if we do a little “prompt engineering” and ask the model to reason about the headline, we get better results:
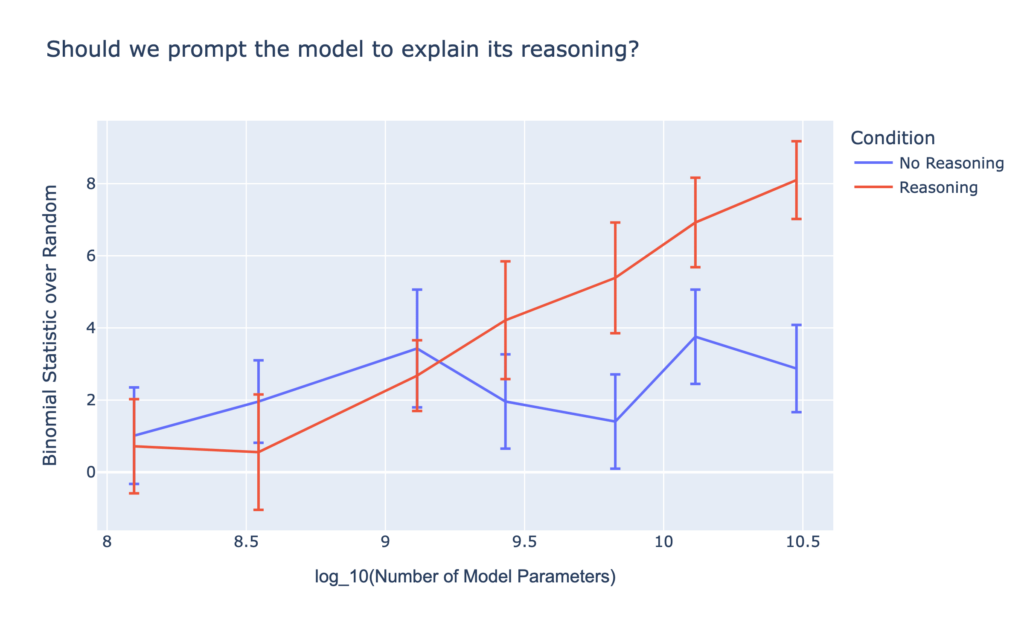
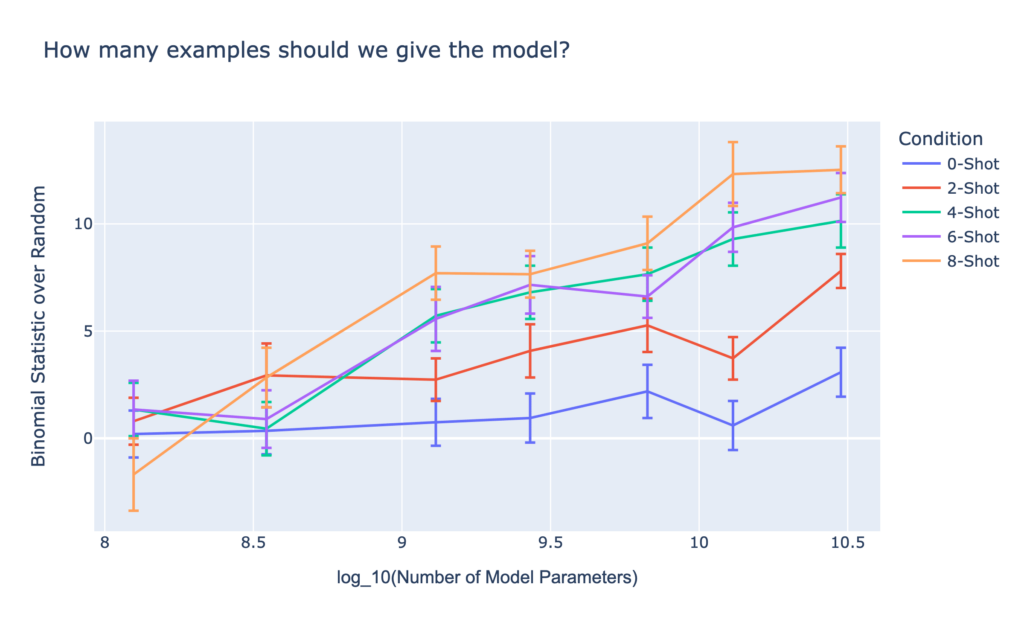
We also find results consistent with other domains, namely that the larger the LLM, the better the results. Additionally, the more examples we provide the model of positive and negative headlines before prompting it on a new headline, the better it does, and the effect compounds with model size:
Clearly this is just the start, and there are many similar (and very different) experiments we can try to keep boosting accuracy. Even these simple examples show the exciting capabilities of LLMs. While you can’t necessarily ask them anything and expect a useful out-of-the-box answer, a bit of creativity and formulaic tinkering can lead to some very promising results.
Signal Architecture Search
By Louie Putterman
At the core of many trading strategies is the notion of a “signal.” Signals are a function which take in some features of the world and output a value which is correlated with the future movements of the market. Basic signals can be something like the sentiment of words in news headlines or the relative strength of an earnings report to the predicted values. Often, signals are guided by human intuition and are thus necessarily limited in their scope and complexity. In this project we explored what happens when we equip evolutionary algorithms with rich data, and train them to discover signals.
In financial markets, data is everywhere. However, if we are going to learn and build functions on this data, we must require that it has a constrained shape. Fortunately, the market itself is already organized into something called an order book. The order book contains two sides, the bid (buying) and the ask (selling), where each side is then sorted into levels. Each level contains a price (of the corresponding ask or buy) and a size. This data is sorted by price, and by limiting ourselves to only the top few levels, we can be guaranteed to have relevant, informative, and well-shaped data.
Next, we have to decide what kinds of functions we want to learn. We want them to be expressive enough to capture complex trends, but not so complex that their latency becomes an issue. A simple choice for expressing this kind of computation is with the four common operations (+-*/) and an identity operation. With this function vocabulary, we can quite easily generate a random computation graph where each node is an operation. Each node has two input edges corresponding to the features that are being fed in. The output from any node is the result of applying the nodes’ operation to its input features.
Finally, the question becomes how we can evolve these functions to learn signals. As in any evolutionary algorithm, we need to decide how to initialize our population, decide who survives each round, and create the next round of offspring. Fortunately, our fitness function is quite straightforward – just the correlation between the function’s output and the future behavior of the asset. Initializing the population is similarly straightforward, as we can simply randomly generate input edges and operations in a computation graph. Finally, to generate the next round of offspring, we introduce the notion of a mutation – simply put, an alteration of the operation or input edges to any specific node. With all of this infrastructure, we are then able to evolve computation graphs to find signals in data. Experimentally, these signals generalized to our testing data and outperformed our baseline signals which accounted for market imbalance.

Above, we can see the evolutionary process of one of these computation graphs. The colors of nodes correspond to the strength of the correlation of the output, and the red path shows which operations are used on the way to the strongest output.
Transformers for Market Data
By Sean Mann and Jerry Mao
Transformers, a type of neural network, have been all the craze in natural language processing recently – as discussed above, models like GPT-3 have been producing astonishingly good results across a wide range of language-related tasks, such as text generation and question answering. These model architectures have impressive abilities to learn complex relationships in sequential, possibly non-numeric, data. It’s natural to wonder whether transformers are also well-suited to learning structure in financial data. We attempted to understand this at two different temporal scales: tick-by-tick order book events for a single instrument, and minute-to-minute returns across a broad cross-section of instruments.
Tick-by-tick Data
Tick data is the most fine-grained data available from financial markets. Various market participants in the market place and cancel orders to reflect their updated beliefs and desires, and sometimes finding a counterparty with a mutually agreed upon price to trade with. The order book represents the state of all active orders, so being able to predict future order books, or somewhat equivalently future orders, would be immensely useful for trading.
We first need to represent the order book in a way that a neural network can understand. A big challenge for this project was representing an order book accurately and succinctly as a vector of numbers, while capturing its discrete aspects such as discrete prices and order sizes. We found that there are intricate relationships between representation and the model’s ability to learn and extrapolate.
Once a good representation scheme is identified, the issue of model architecture and formulation is also an open-ended question: if we represent the order book as a vector of numbers, then predicting a future order book is a simple regression problem, but this framing can make it difficult for the model to represent its own uncertainty about the future, versus probabilities over categories in a classification problem. We investigated integrating transformer architectures with variational autoencoders (VAE) and found we were able to sample diverse sets of future trajectories conditioned on real market data.
Cross-sectional Return Data
A more broadly familiar form of market data is the time series of the price of each asset, which we can equivalently view as a sequence of returns over time. We put aside the classic quantitative finance task of forecasting future stock prices in favor of understanding what types of behaviors are exhibited by price/return trajectories generated from transformer models, especially when generating for a broad cross-section of instruments.
We considered models with GPT-style neural networks as their core module, with varying embedding algorithms and decoder modules that generate prices. In particular, we feed in historical return data for many instruments and expect to receive future return data. We experiment with a variety of regression objectives to train our generative models, in addition to quantizing stock returns and using classification objectives. We compared these with simpler baseline models like random walks and attention-free linear autoregressors.
We found that our regression-based models generally performed better at capturing symbol-to-symbol correlations, with correlation matrices on future returns more closely approximate the ground truth matrix. However, the trajectories produced by these models tended to become “degenerate” quickly, as the regression objectives encouraged predictions near the mean; that is, almost-zero returns. In this sense, any variance in the generated price trajectories would be predominantly noise.
On the other hand, our model trained on the quantized dataset did not suffer from such an issue. One explanation may be that the classification objective removes any strong prior on the shape of the return distribution, unlike regression. This enabled more diverse distributions from which generative price paths could be sampled.
There is yet so much more to be explored, such as understanding what the attention modules are learning, and understanding what types of market dynamics the model finds more difficult to learn.